
Key Takeaways
- INP replaced FID as Google's official Core Web Vital metric for website responsiveness in March 2024.
- INP evaluates qualifying interactions during a page visit and reports a representative interaction latency, evaluated at the 75th percentile across page visits.
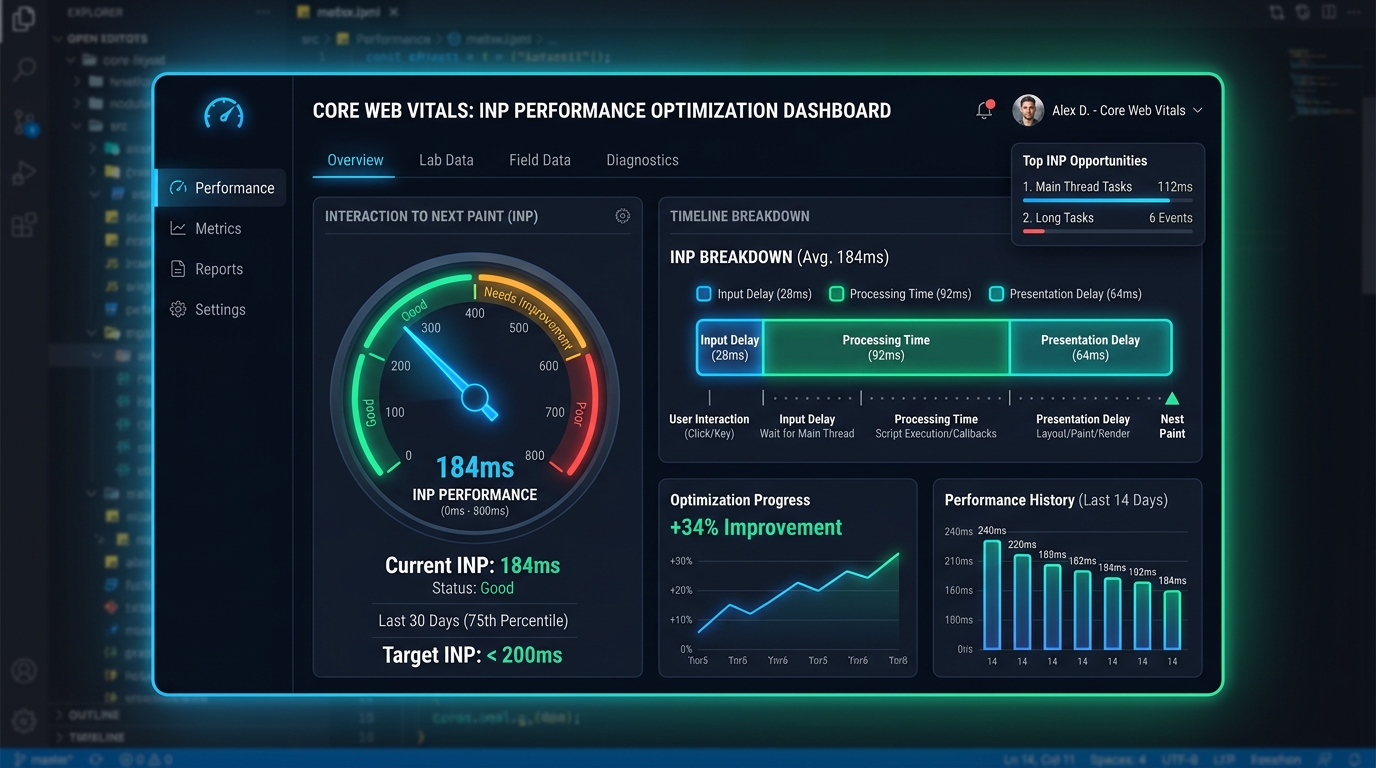
- The 3 phases of interaction latency are Input Delay, Processing Duration, and Presentation Delay.
- Long-running JavaScript executed on the main thread is one of the most common causes of poor INP.
- Modern APIs like
scheduler.yield()allow the browser to process pending high-priority work (rendering, user input) before resuming long tasks.
Have you ever clicked a button or tapped a navigation menu on a web application, only to experience a frustrating delay before anything updates on screen? That lag directly impacts your Interaction to Next Paint (INP) — a crucial metric for Core Web Vitals 2026.
Following Google's official deprecation of First Input Delay (FID), INP serves as the authoritative benchmark for browser rendering performance and overall website responsiveness. In this comprehensive technical guide, we will unpack the exact anatomy of INP, examine common real-world bottlenecks, profile main thread blocking in Chrome DevTools, and implement developer-tested JavaScript performance optimization techniques.
What is Interaction to Next Paint (INP)?
According to the official Google Web.dev INP documentation, INP evaluates all qualifying interactions during a page visit and reports a representative interaction latency for that visit. Google then evaluates the 75th percentile of those page visits when determining your site's Core Web Vitals performance.
Unlike FID (which only recorded the input delay of the very first click), INP accounts for interactions throughout the entire duration of a session and measures the complete time until the next frame is painted.
| INP Latency | Rating | User & SEO Impact |
|---|---|---|
| ≤ 200 ms | Good | Instant visual feedback; optimal page responsiveness |
| 201 ms – 500 ms | Needs Improvement | Noticeable lag; potential frustration on mobile devices |
| > 500 ms | Poor | Unresponsive UI; high risk of multi-clicks & bounce rate |
The 3 Phases of Interaction Latency
When a user interacts with a page element, the total time until the browser renders the updated visual frame consists of three distinct phases defined in the W3C Event Timing Specification:
- Input Delay: The time spent waiting for background main thread blocking tasks to complete before the event listener starts.
- Processing Duration: The execution time of your JavaScript event callbacks (e.g., event handlers, framework state updates).
- Presentation Delay: The time required by the browser engine to perform style recalculations, layout reflow, compositing, and painting the new frame.
Anatomy of an Interaction (INP Lifecycle)
INP focuses on discrete interactions such as clicks, taps, and keyboard input. Continuous interactions like scrolling and pointer movement are generally excluded.
Common Causes of Poor INP
To effectively improve INP score, developers must address both script execution delays and rendering bottlenecks. Common real-world culprits include:
- Large React / Framework Re-renders: Triggering synchronous state updates across massive component trees upon user clicks.
- Third-Party Chat Widgets & Trackers: Heavy marketing analytics and customer chat scripts running long tasks on the main thread during interaction.
- Synchronous API Processing: Executing blocking loops or expensive data formatting synchronously inside click event handlers.
- Heavy Global Event Listeners: Attaching unoptimized
keydownorpointerdownhandlers towindowordocument. - Large DOM Updates & Layout Thrashing: Reading layout properties (like
offsetHeight) immediately after writing DOM changes, triggering forced reflows.
How to Measure & Monitor INP
Comprehensive web performance optimization requires analyzing both real-user field data and lab measurement tools:
- Chrome DevTools Performance Panel: Open Chrome DevTools Performance documentation, record an interaction, and inspect the Interactions track to isolate Input Delay, Processing Duration, and Presentation Delay.
- PageSpeed Insights & CrUX: View real-user field data from the Chrome UX Report (CrUX) to see 75th percentile INP metrics aggregated over 28-day periods.
- Google Search Console: Check the Core Web Vitals report to identify URL clusters failing the 200 ms INP threshold on mobile or desktop.
- Lighthouse: Run lab audits to catch long tasks and rendering delays during development.
-
web-vitalsJavaScript Library: Integrate Google's lightweight web-vitals library to record real-user INP metrics to your analytics endpoint:import {onINP} from 'web-vitals'; // Record and report real-user INP data onINP((metric) => { console.log('INP Score:', metric.value, 'ID:', metric.id); // Send metric to your analytics server });
For broader sitewide performance strategies, read our guide on how to improve website page speed and Core Web Vitals and check how tag management impacts performance in our Google Tag Manager 2026 guide.
How to Fix INP: Yielding to the Main Thread
Long-running JavaScript executed on the main thread is one of the most common causes of poor INP. When the main thread is occupied with heavy tasks, user taps and clicks cannot be processed immediately, leading to high input delay.
To resolve this, developers can split monolithic work into smaller asynchronous chunks using the modern MDN scheduler.yield() API:
// Modern main-thread yielding helper function
async function yieldToMain() {
  if ('scheduler' in window && 'yield' in window.scheduler) {
    return await window.scheduler.yield();
  }
  // Fallback for browsers without scheduler.yield support
  return new Promise((resolve) => {
    setTimeout(resolve, 0);
  });
}

// Example: Heavy processing broken into responsive chunks
async function processLargeDataSet(items) {
  for (let i = 0; i < items.length; i++) {
    processSingleItem(items[i]);

    // Yield to main thread every 50 items so the browser can paint frames
    if (i % 50 === 0) {
      await yieldToMain();
    }
  }
}
Execution Flow: Monolithic Task vs. scheduler.yield()
scheduler.yield() allows the browser to process pending high-priority work such as rendering and user input before resuming your task, making interactions feel more responsive than many setTimeout-based approaches.
Optimizing DOM Size & Browser Rendering Performance
High Presentation Delay often occurs when rendering complex layout shifts or heavy DOM updates. Very large DOM trees can increase style recalculation and layout work, slowing down the paint step after event callbacks complete.
Here are three practical ways to optimize rendering efficiency:
-
CSS
content-visibility: auto: Defer layout and style calculations for off-screen sections until the user scrolls near them. - Web Workers: Move heavy background computations out of the main thread into dedicated Web Workers.
- Lightweight HTML vs. Structured Data: Use semantic, lightweight HTML to reduce rendering work. Structured data helps search engines understand your content (learn more in our Schema markup guide) but has little direct impact on INP performance. Clean HTML helps you increase organic search traffic by ensuring search crawlers and users enjoy fast page loads.
Conclusion & Strategic Action Plan
Optimizing Interaction to Next Paint (INP) is essential for modern web responsiveness, user retention, and search engine visibility. By profiling long tasks, yielding execution with scheduler.yield(), and monitoring CrUX field metrics, you can keep your pages fast and compliant with Core Web Vitals 2026.
Need expert help auditing your site's performance or building a high-speed web application? Explore SCloud's professional web development services and custom technical SEO optimization solutions today.
Frequently Asked Questions
What is Interaction to Next Paint (INP)?
INP evaluates all qualifying interactions during a page visit and reports a representative interaction latency for that visit. Google then evaluates the 75th percentile of those page visits when determining your site's Core Web Vitals performance.
What is a good INP score?
An INP score of 200 milliseconds or less indicates good website responsiveness. Scores between 200 ms and 500 ms need improvement, while scores above 500 ms are considered poor.
How does INP differ from First Input Delay (FID)?
FID only measured the input delay of the very first interaction on a page. INP evaluates all qualifying interactions during a visit and measures the full duration until the next frame is painted.
How does scheduler.yield() help reduce input delay and fix INP?
scheduler.yield() allows the browser to process pending high-priority work such as rendering and user input before resuming your task, making interactions feel more responsive than many setTimeout-based approaches.